15. CUSUM (Cumulative Sum) and Change Points
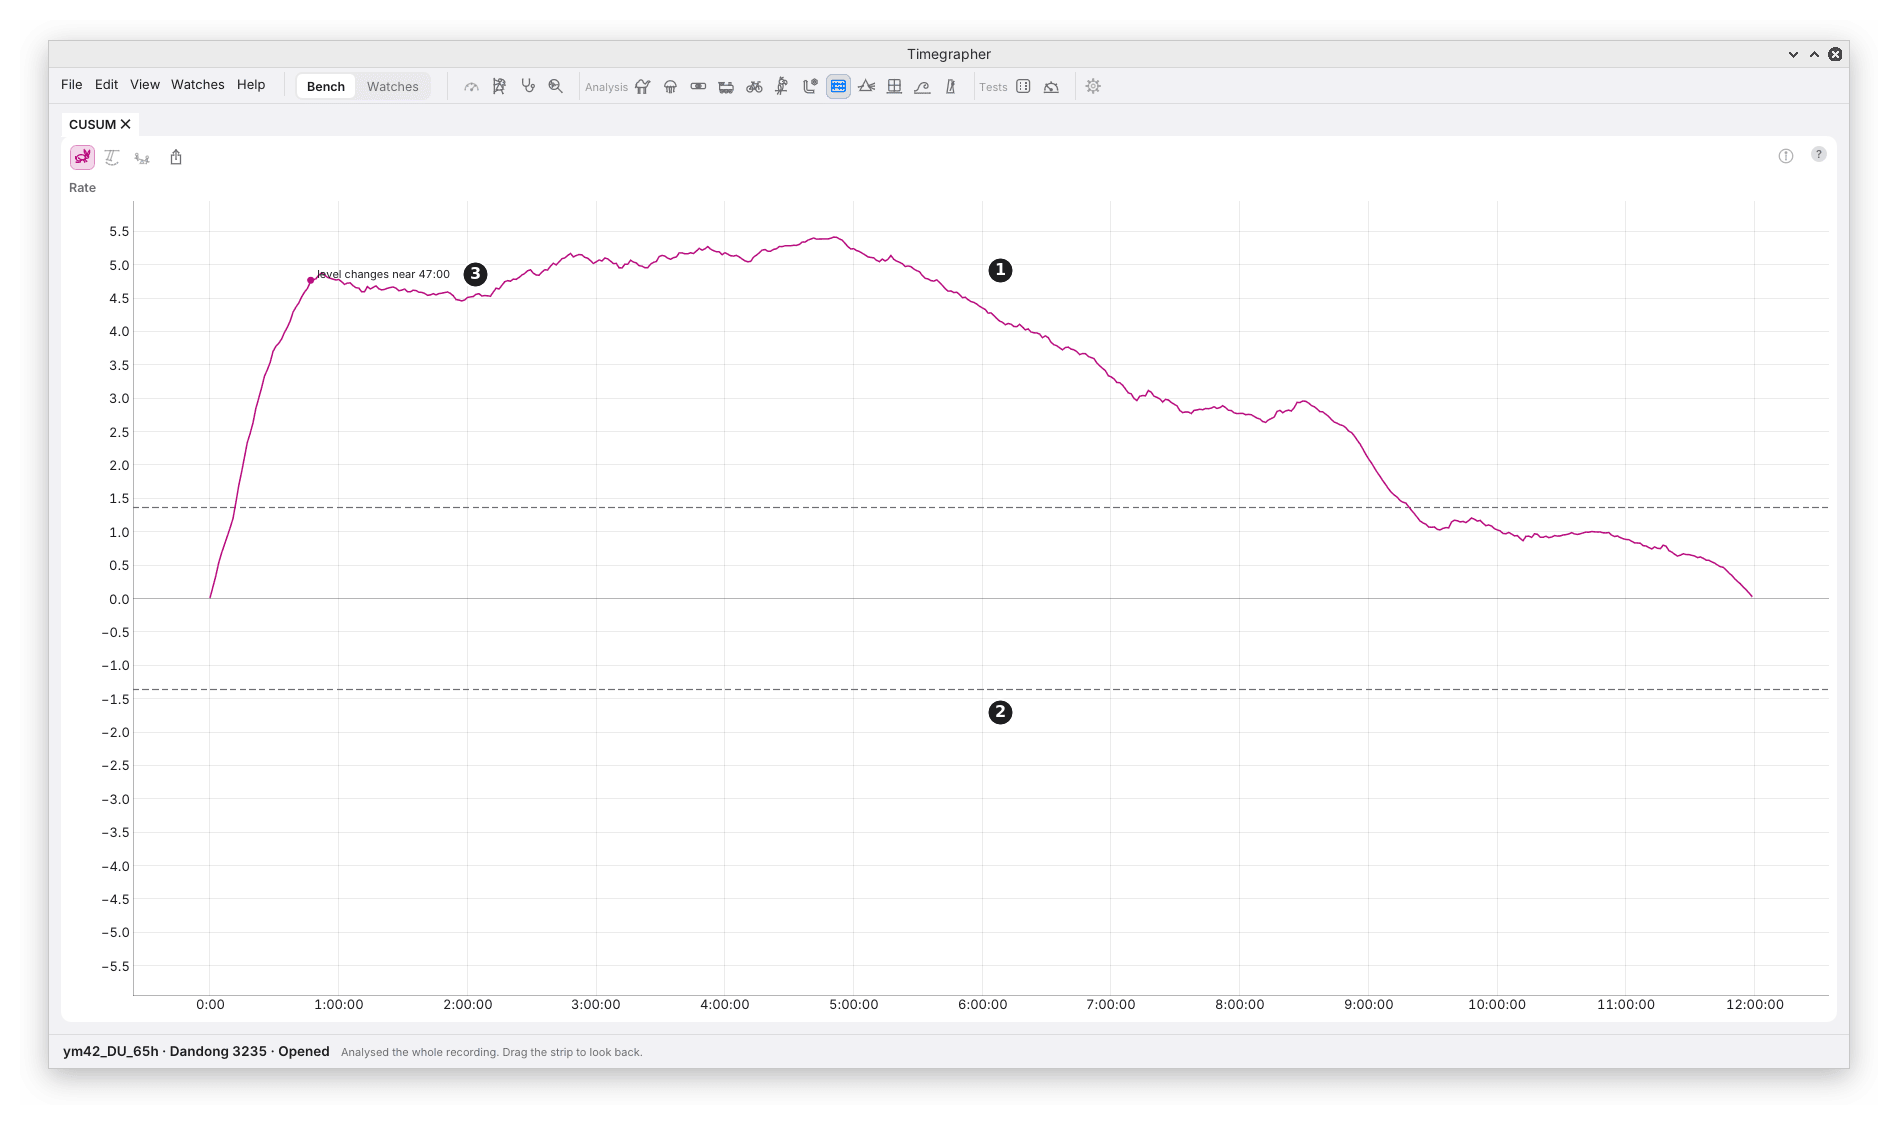
What it shows: the CUSUM, the cumulative sum: the running total of each reading’s distance from the mean of all of them, scaled so that the same lines hold for any take. With no change of level the total wanders about 0. Where the level changes, it turns.
Why you’d use it: to tell whether the level of a series changed during the take, and when. A step of a fraction of the scatter is hard to see in the readings themselves; the running total adds it up reading after reading until it stands out. It is how you check a knock, a change of wind or a change in the watch that you suspect moved the rate.
| Mark | Part | What it shows |
|---|---|---|
| 1 | The CUSUM | The running total, against the time of the take. |
| 2 | The dashed lines | ±1.36: readings with no change of level, correlated or not, stay inside them about 95 times in 100. |
| 3 | The largest excursion | The point furthest from 0. When the headline names a level change, the corner nearest it gets a dot and a note, “level changes near 47:00”. |
Reading the Shape
The total goes down while the readings are under the mean and up while they are over it. So:
- A V or an upturned V (a tent) is a step: under the mean, then over it, or the reverse. The corner is where the level changed.
- A smooth bowl or dome is a slide: the level moving gradually, not in one step.
- A wander inside the lines is no change of level.
In the picture are the first 12 hours of the Dandong 3235 run-down from chapter 8. The total climbs steeply from the start, far past the dashed line, and turns sharply at 47 minutes: the corner of a tent, the step from a fast first stretch to a slower level. The headline names it, and the corner is marked “level changes near 47:00”. From there to about 5 hours the total drifts gently up, then slides down to 9½ hours: the rate a little over its mean, then a little under it: changes too small beside the scatter for any single reading to show. The steeper fall near 9 hours is the dip that Readings Over Time shows there (chapter 10).
Change Points
The change finder splits the readings into stretches of constant level. Its stretches are what Readings Over Time draws, and their number is in the Info panel.
- It reads 30 s block medians, so one stray reading doesn’t make a stretch.
- It splits the take at the best place, then splits each part again, as long as each stretch is at least 5 minutes long.
- A split is kept only when it is strong evidence against one level: its gain must beat 3 × the log of the number of blocks, and never less than 15 (M9).
The finder only places the cuts. Whether the level changed is the CUSUM’s call.
When a Level Change Is Named
The headline names a level change, and the CUSUM marks its corner, only when all of these hold:
- the change finder cut the readings;
- the CUSUM’s own test passes: the chance of an excursion this large with no change of level is under 0.01;
- that test also passes Holm’s correction across every test of the take (chapter 9);
- the stretches explain at least a fifth of the readings’ variation;
- a slide doesn’t explain the readings as well or better.
A step that only the CUSUM shows still bends the line; it just isn’t named.
How It Is Worked Out
- Distance from the mean, summed from the first reading to each one.
- Scaled by σ√n, n the number of readings and σ their long-run scatter: the scatter from one reading to the next, allowing for how much each reading follows the last (M7). The correlation is read once the largest step is taken out, so a real step can’t hide itself by widening the scale.
- The ±1.36 lines come from the Kolmogorov distribution: the largest excursion of a running total of independent noise stays under 1.36 on 95 takes in 100. The CUSUM’s p-value is that distribution’s tail at the largest excursion. M9 gives the formula.
What to Look For
| What you see | What it can mean |
|---|---|
| The line inside the dashed lines | No change of level. |
| A V or a tent past the lines, the corner marked | A step in the level: the note says when. |
| A bowl or a dome past the lines | A gradual change: a slide or a trend. |
| Several corners | Several steps: the stretches are in Readings Over Time. |
What It Can’t Tell You
- The size of the step. The CUSUM’s height is in units of scatter, not s/d. The stretches’ levels are in Readings Over Time and the Info panel.
- The cause. A knock, a change of wind, a temperature change and a change in the stand’s contact give the same shape.
- A change in the last or first few minutes. Stretches are at least 5 minutes long.
Previous: Allan Deviation · Next: FFT
This page comes from the app's user guide at v1.0.1. See it on GitHub.